AI Workspace Quickstart
Last Updated: November 13, 2025
This quickstart will guide you through uploading your data, running workflows, and exploring your results in a visual interface.
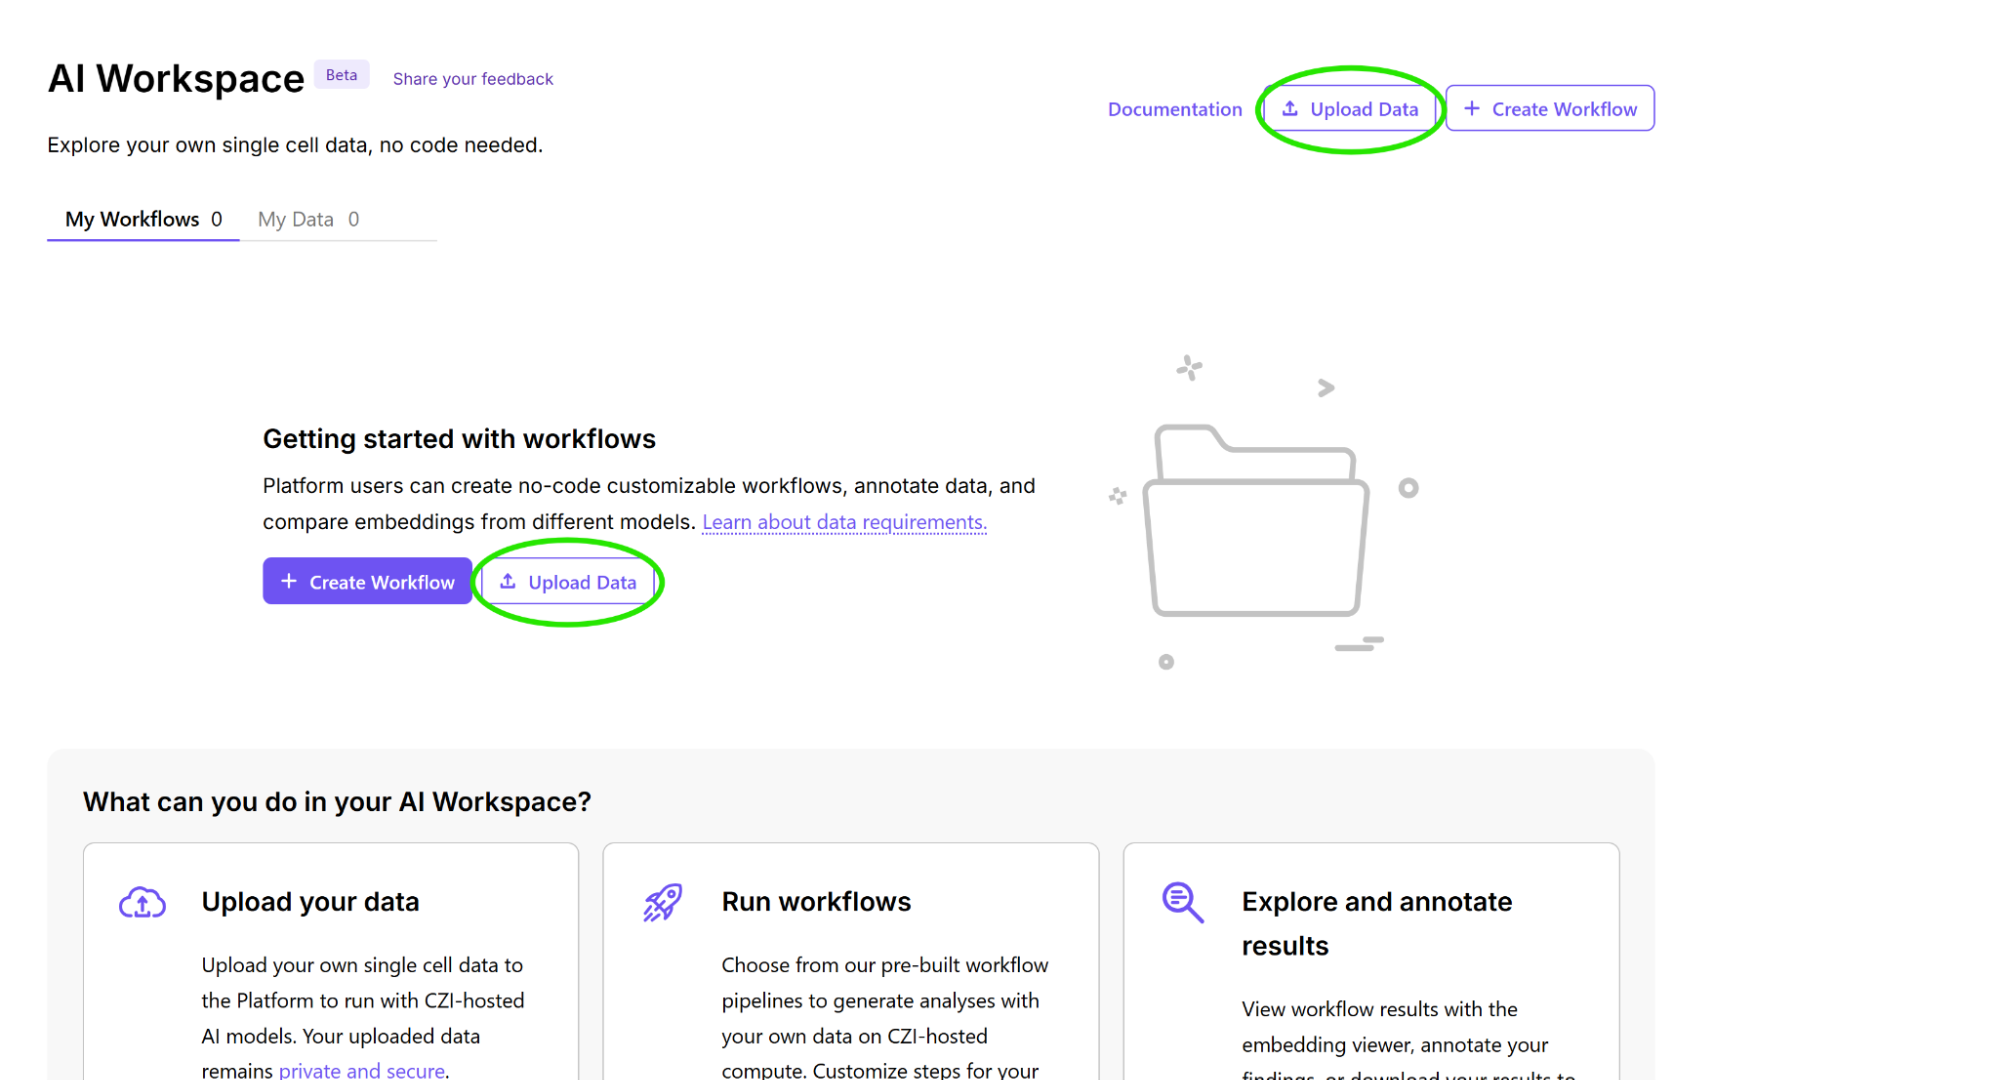
1. Upload your data
From the AI Workspace homepage, select either one of the Upload Data buttons to open the Upload Data dialog. Follow the instructions in the dialog to upload your data.
User files are automatically deleted 6 months after upload, while workflows and outputs are deleted 6 months after they are created.
Data Requirements
Data you upload must be in the following format:
- File format: Files must be in H5AD format (.h5ad extension). Users can convert RDS files to H5AD files using anndataR.
- Size Limit: Maximum 10GB per file
There are additional data requirements for each model:
Model | Workflows | Additional Requirements |
|---|---|---|
| PCA | Standard | 2M cell limit |
| scVI | StandardCompare |
|
| Transcriptformer | StandardCompare |
|
For information about organism support and gene identifier requirements, see Data Requirements.
2. Choose a workflow
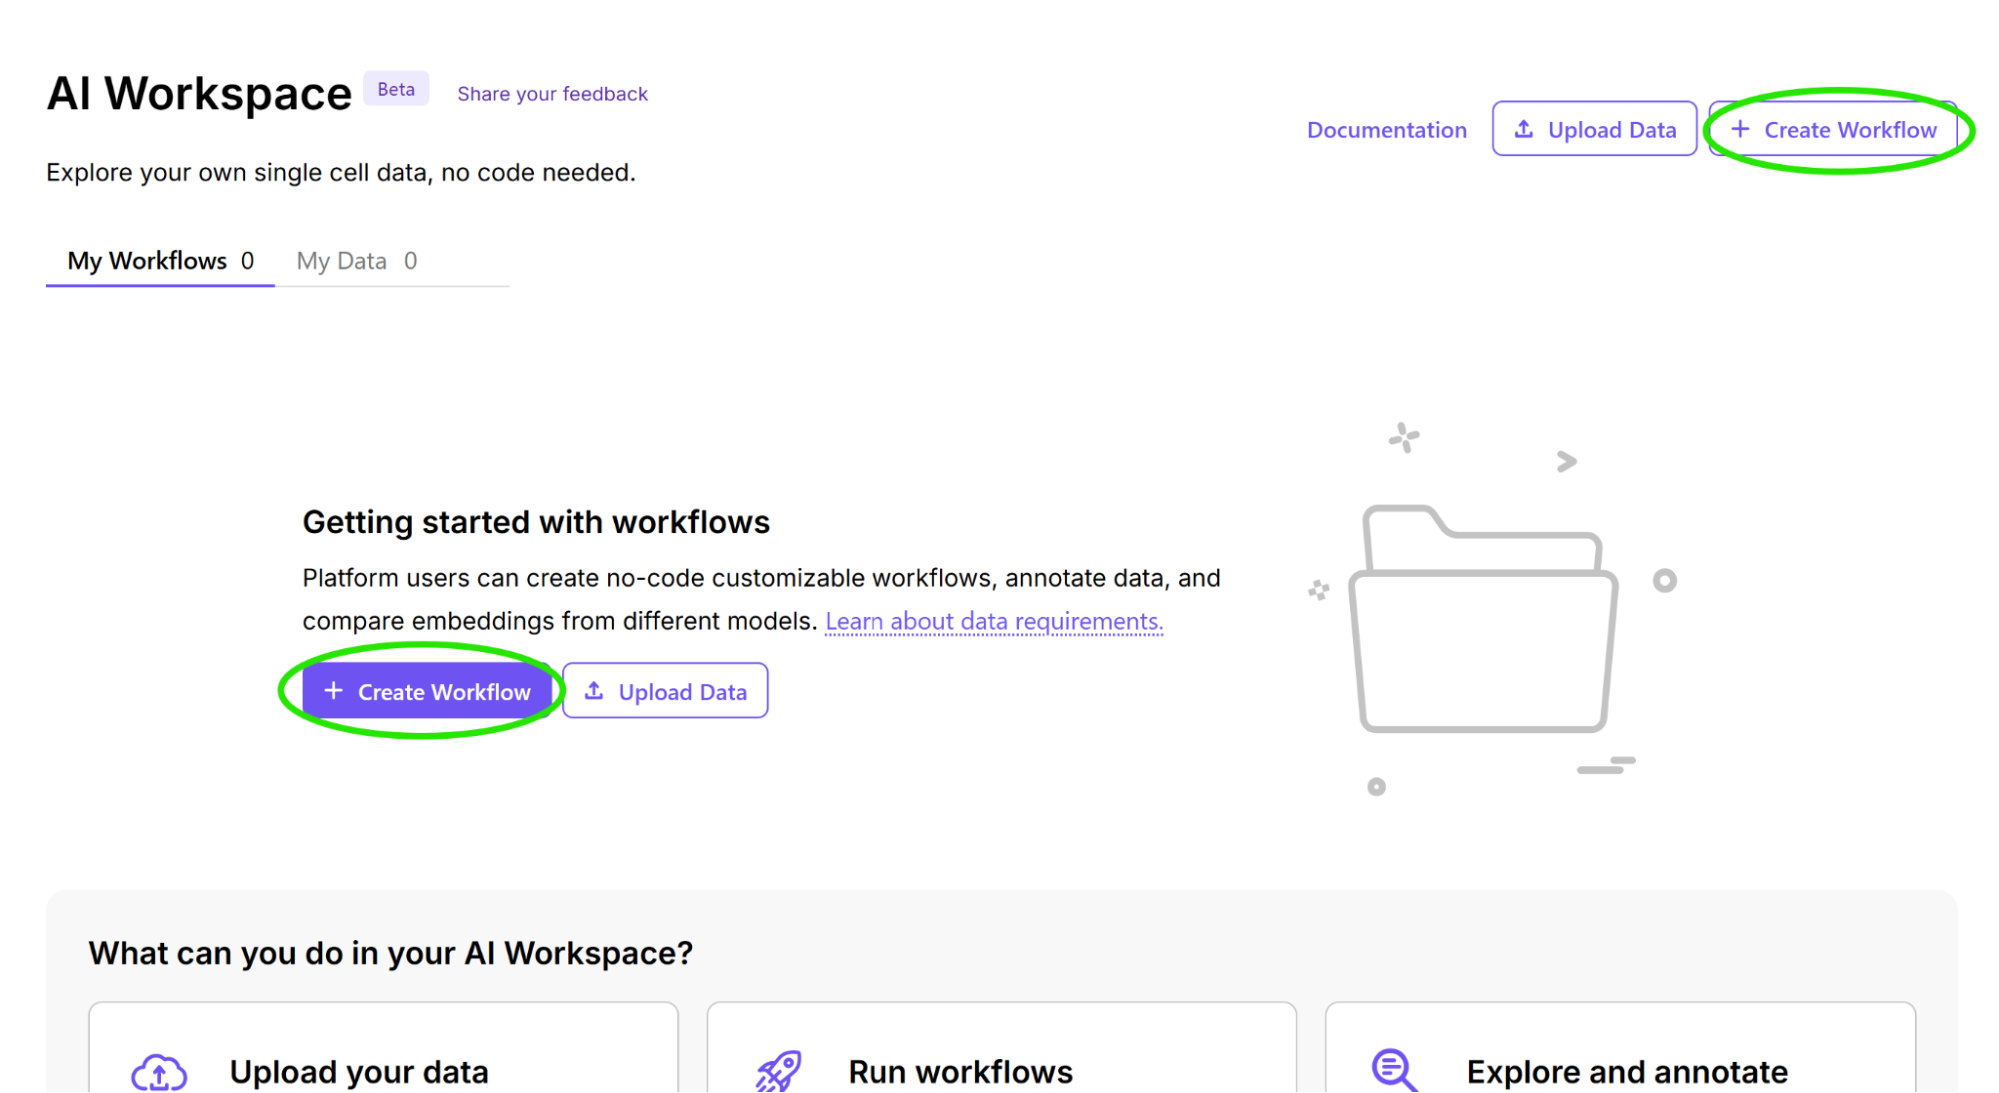
After uploading your data, select the Create Workflow button on the homepage.
Workflow types
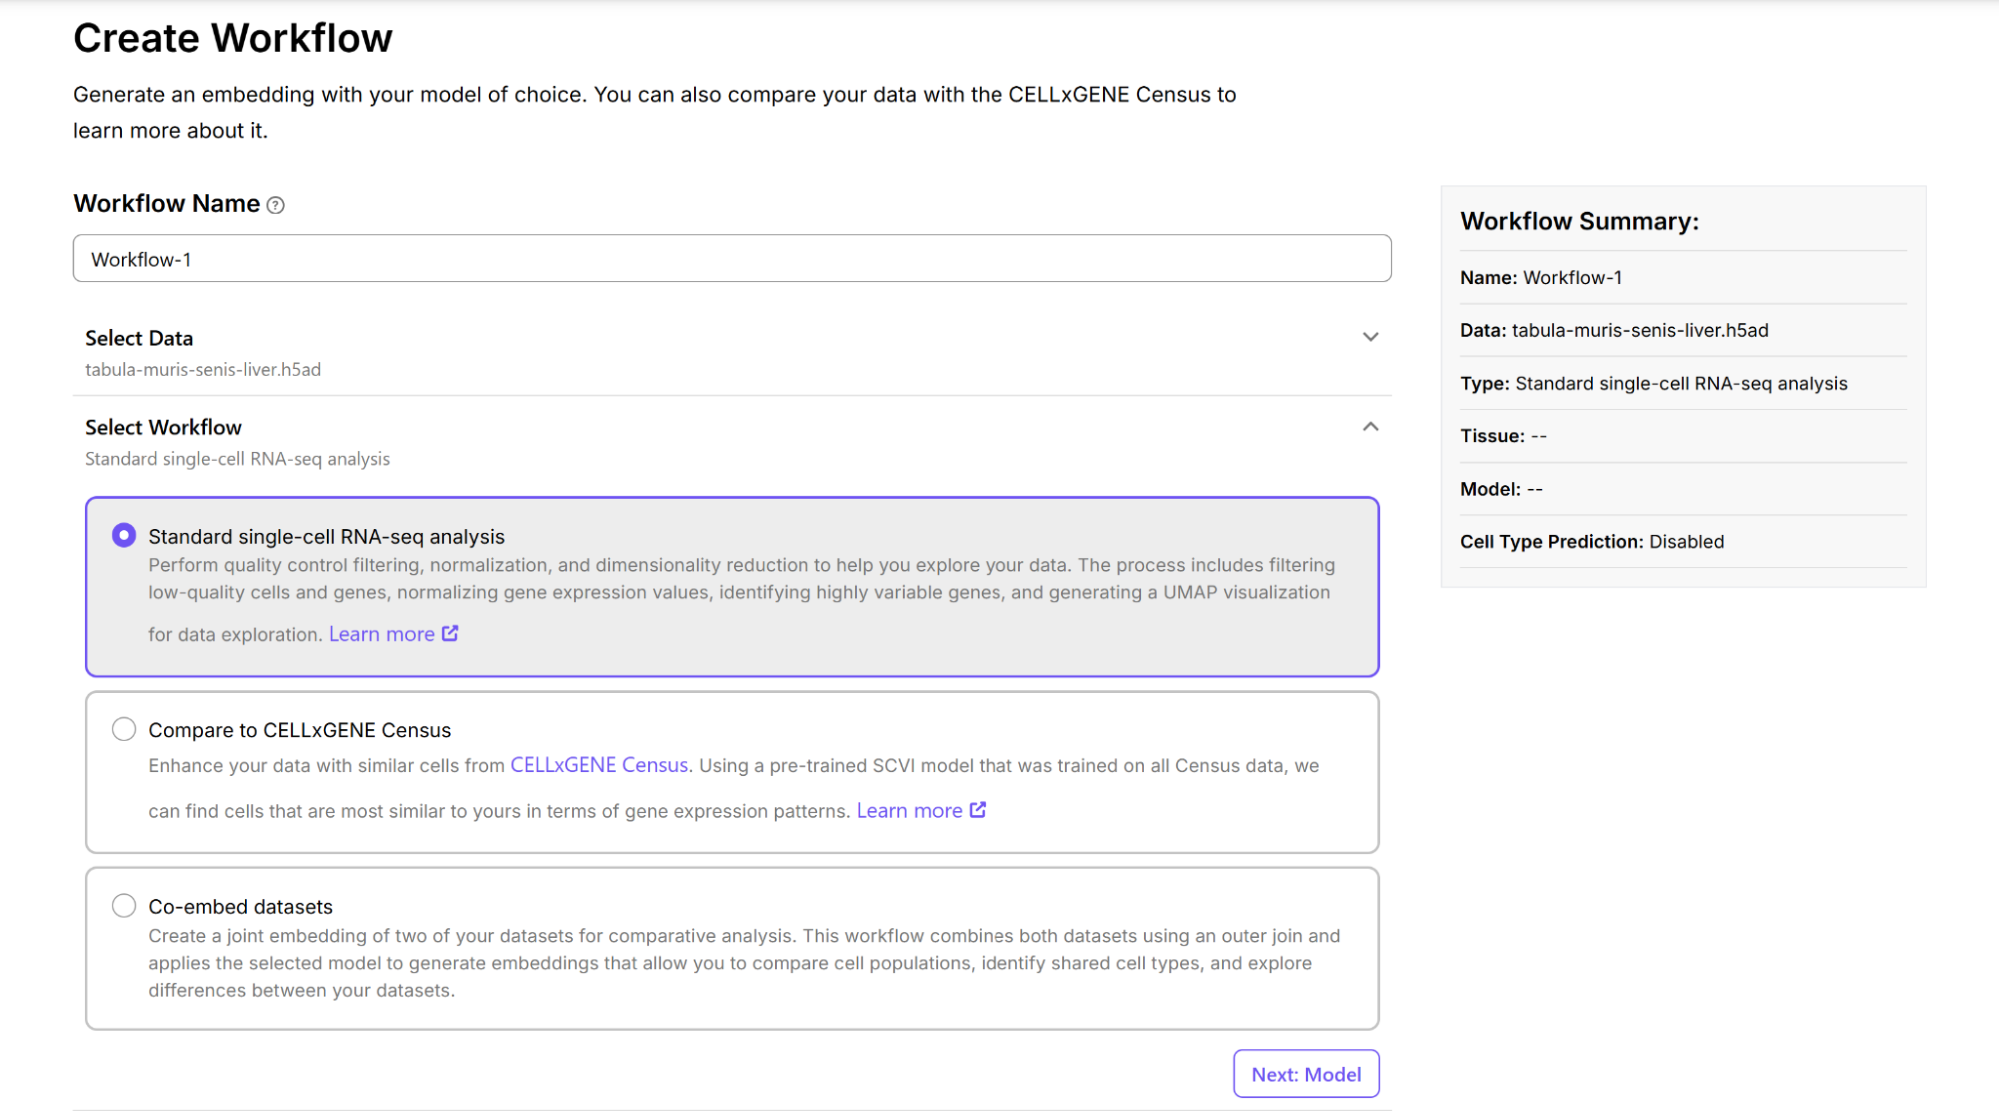
On the Create Workflow page, select the data you wish to analyze and the type of workflow to run. Three main workflow types are available for analyzing single-cell RNA sequencing data.
The “standard single-cell RNA-seq analysis” workflow allows you to generate embeddings with Principal Component Analysis (PCA), scVI, and the TranscriptFormer models and visualize them in 2D space. The “compare to CELLxGENE census” workflow compares data against the CELLxGENE Census reference atlas using the scVI or Transformer models. The “co-embed datasets” workflow allows you to create a joint embedding of two datasets.
3. Select a model
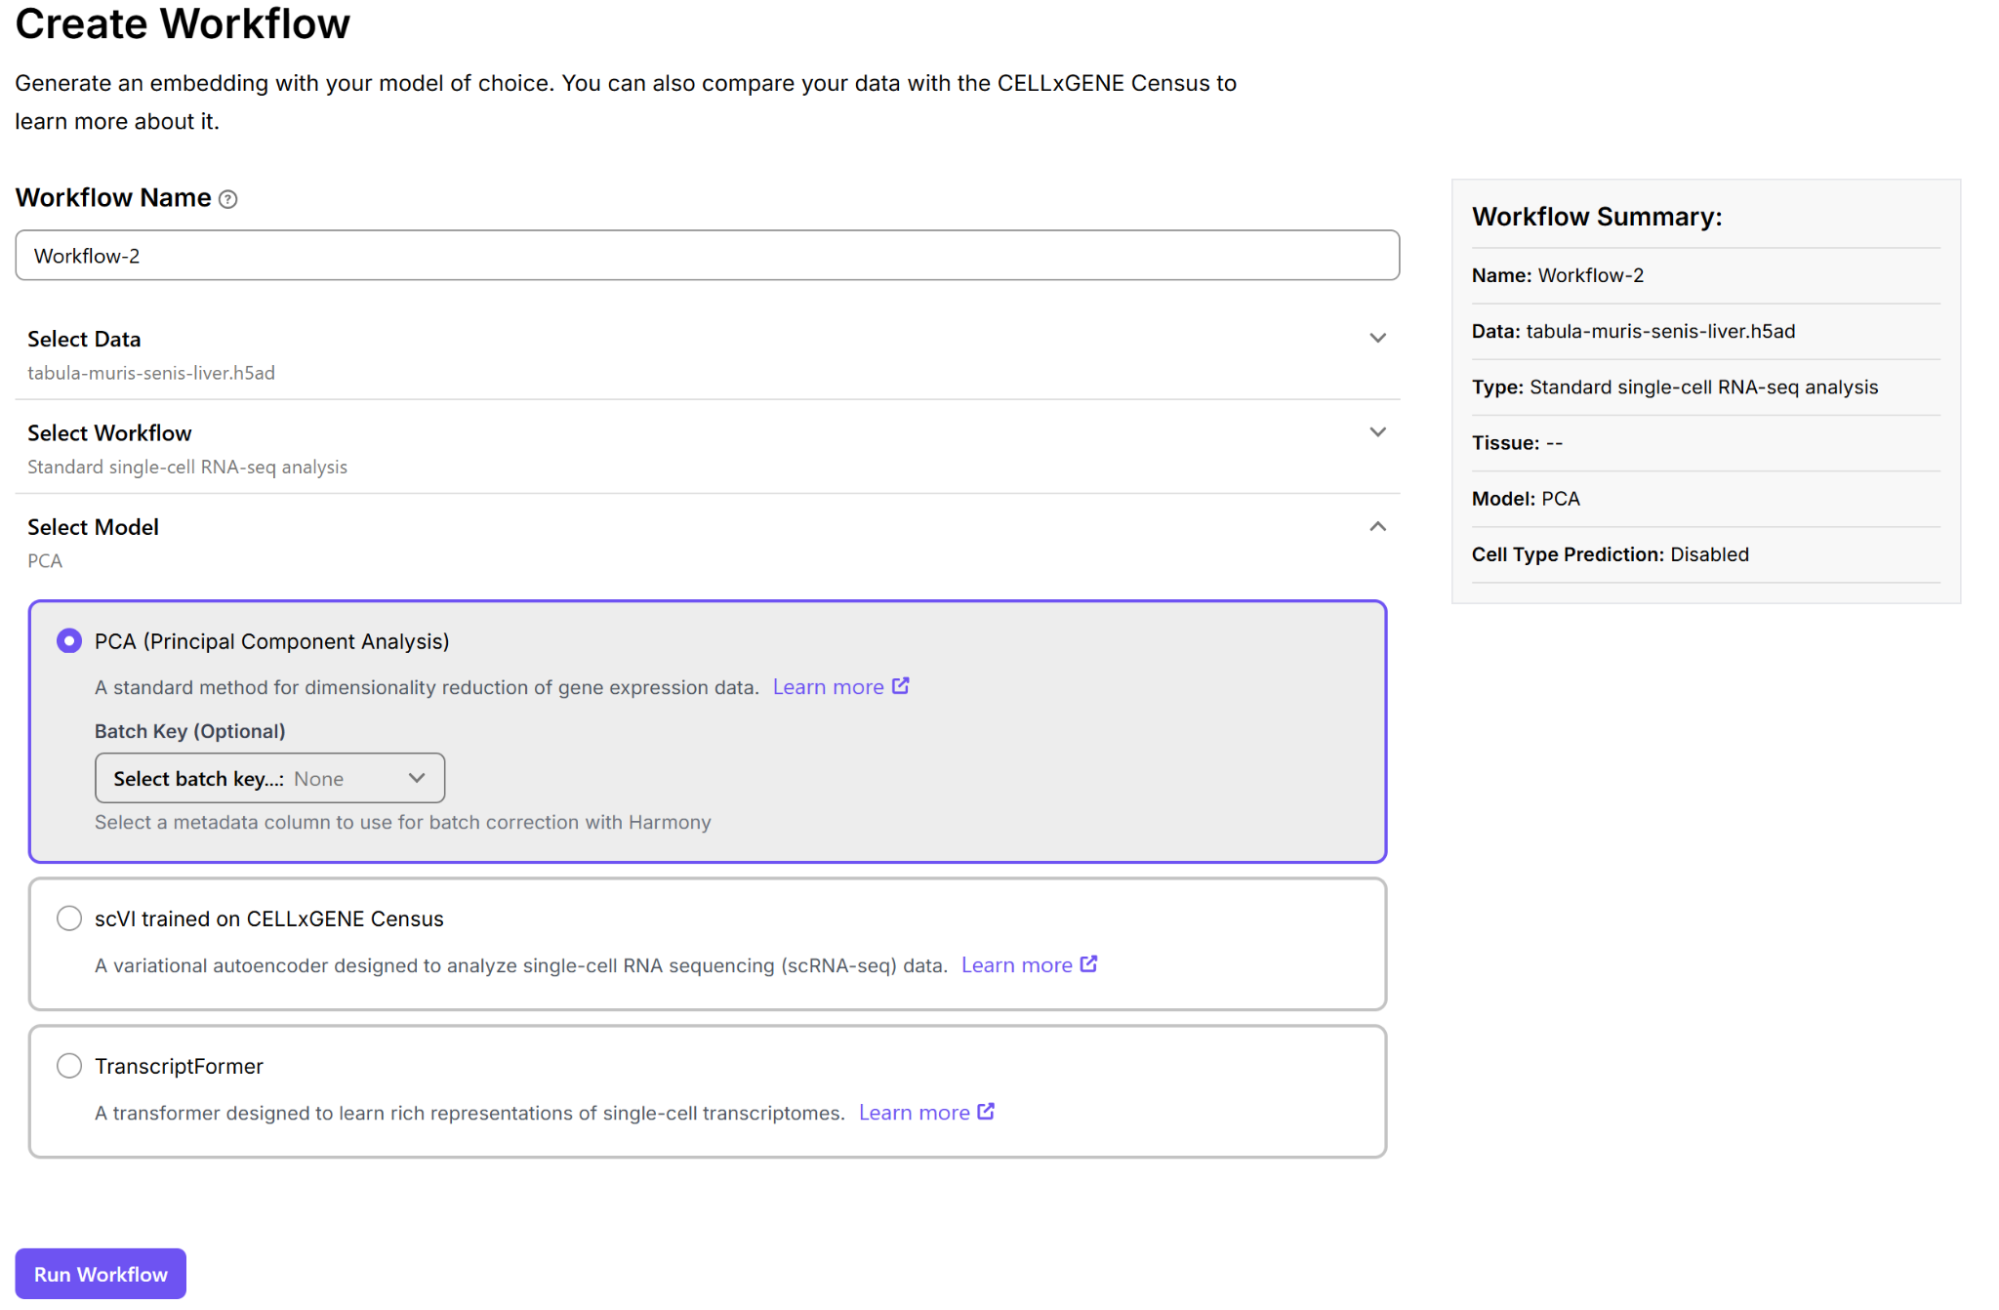
After selecting a workflow, choose the model to use with your data. Three computational models are available for analyzing your single-cell RNA-seq data: PCA, scVI, and Transcriptformer. For information on the models, see here.
4. Run workflow and monitor progress
Select Run Workflow once your model selection is complete to start your job.
Once your job begins running, you can monitor its progress from the homepage.
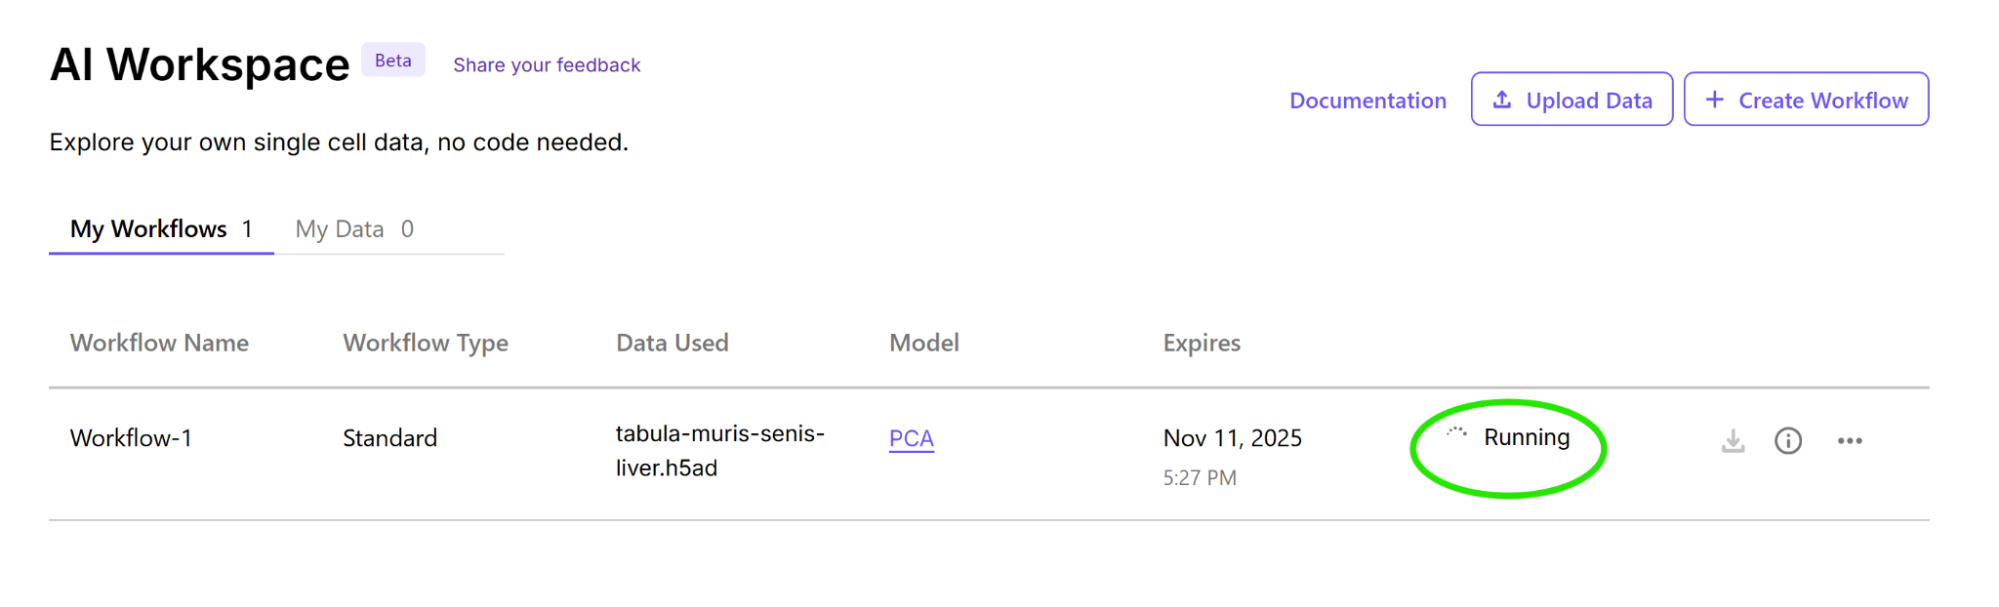
Note: The maximum number of jobs you can run concurrently is three. For more information about job lifecycles, see the Job Management page.
Job logs
Select the Other actions (...) icon to view job logs or delete a workflow.
Workflow parameters
Select the information icon to view workflow parameters.
5. Explore results
Once your workflow is complete, select the Explore button for your workflow tab to view your results in the data explorer.
The left pane of the explorer contains categorical (i.e. cell type, tissue of origin, etc.) and numerical metadata (i.e. QC metadata in histogram form) for all of the cells represented in the embedding plot. If you have other numerical attributes for cells besides QC metadata (i.e. deconvolution predictions for spatial data), they will also be displayed here.
The center pane displays the embedding plot, where each point represents a cell.
The right panel can be used to search for and highlight genes or gene sets of interest.
Add annotations
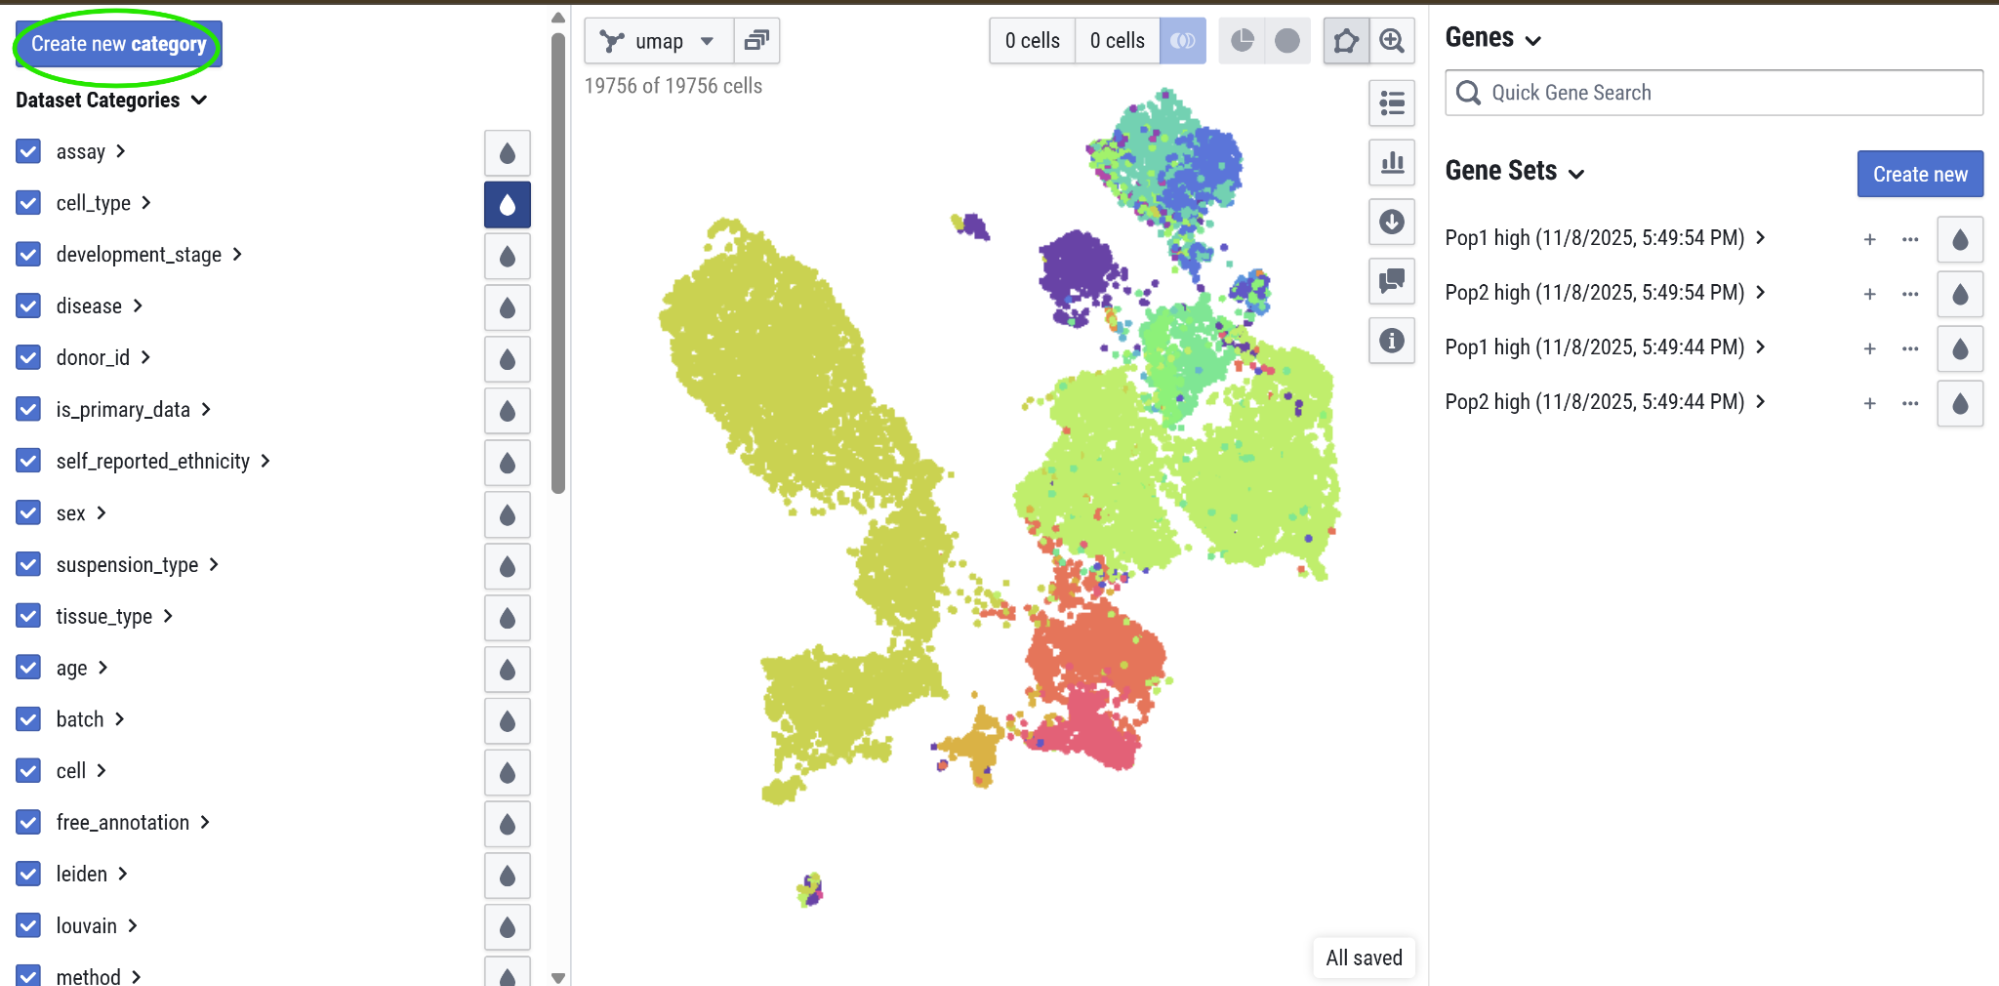
Add an annotation using the Create new category button on the left pane of the explorer. Once the dialog opens, add a category name. You can also use this dialog to duplicate information from an existing annotation.
Add labels
Add a new label to a user-created category by selecting a group of cells in the embedding plot. Then, select the + next to the category name and add a label to your group of cells. Once you begin typing the name of the label, a suggested list of cell types will appear. This suggested list of cell types are what are available in the CellGuide database. If you choose a cell type name on the suggested list, an info icon will appear right next to the label name after label creation that will allow you to view information of this cell type.
With the new annotations in place, you can continue to do data exploration and analysis in the same way as hosted data in CELLxGENE (see CELLxGENE Explorer Tutorials).
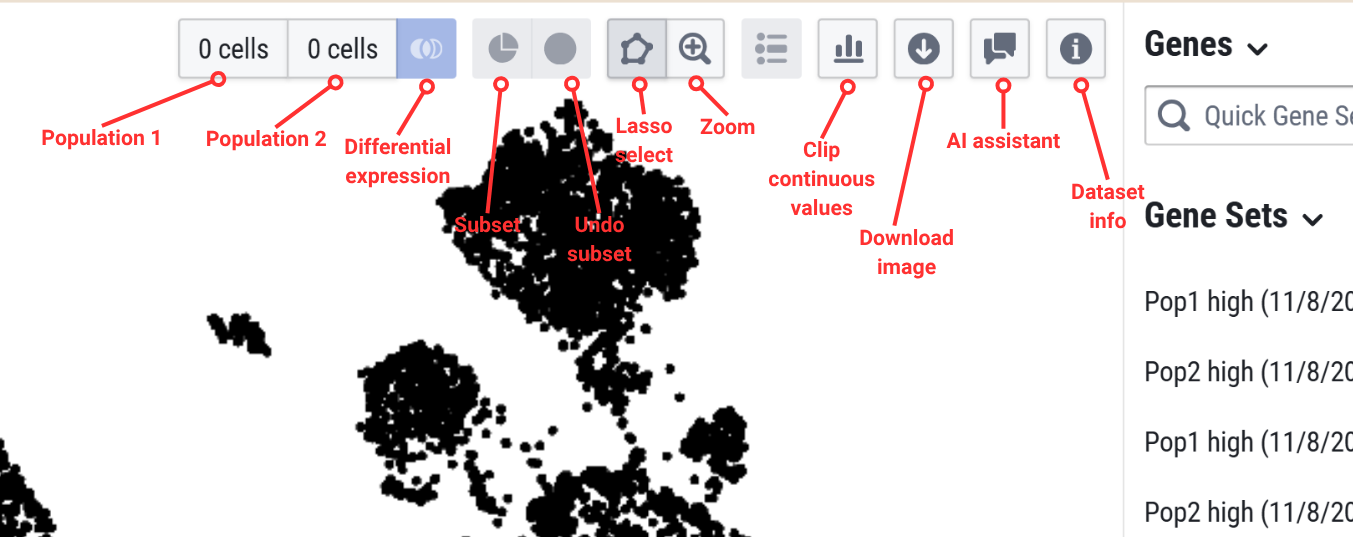
Toolbar
The toolbar in the center pane has the following icons which enables you to create selected populations of interest, download the embedding plot, interact with the AI assistant, and more.
Find marker genes
The explorer allows you to find marker genes between selected cell populations.
First, select your cells of interest using the left pane of the explorer. Use the checkbox next to the metadata category to select or unselect cells of interest. You can add color to the embedding plot and visualize cells of interest by selecting the water droplet icon next to the metadata category. Once you select a population, select the Subset icon in the toolbar to isolate those cells. From here, you can use the right pane of the explorer to check for marker genes in the search bar. You can expand these results and add color to view an embedding plot of the expression.
To further analyze the differential expression, we can divide the selected cells into two populations. Lasso select (with a cursor: click and drag to create a circle) the first population and select the population 1 button. This assigns the cells you selected to population 1. Click the background of the embedding plot to clear your lasso select. Then select the second population, and select the population 2 button. Select the differential expression icon. These new gene sets will appear in the right pane.
CELL x AI assistant
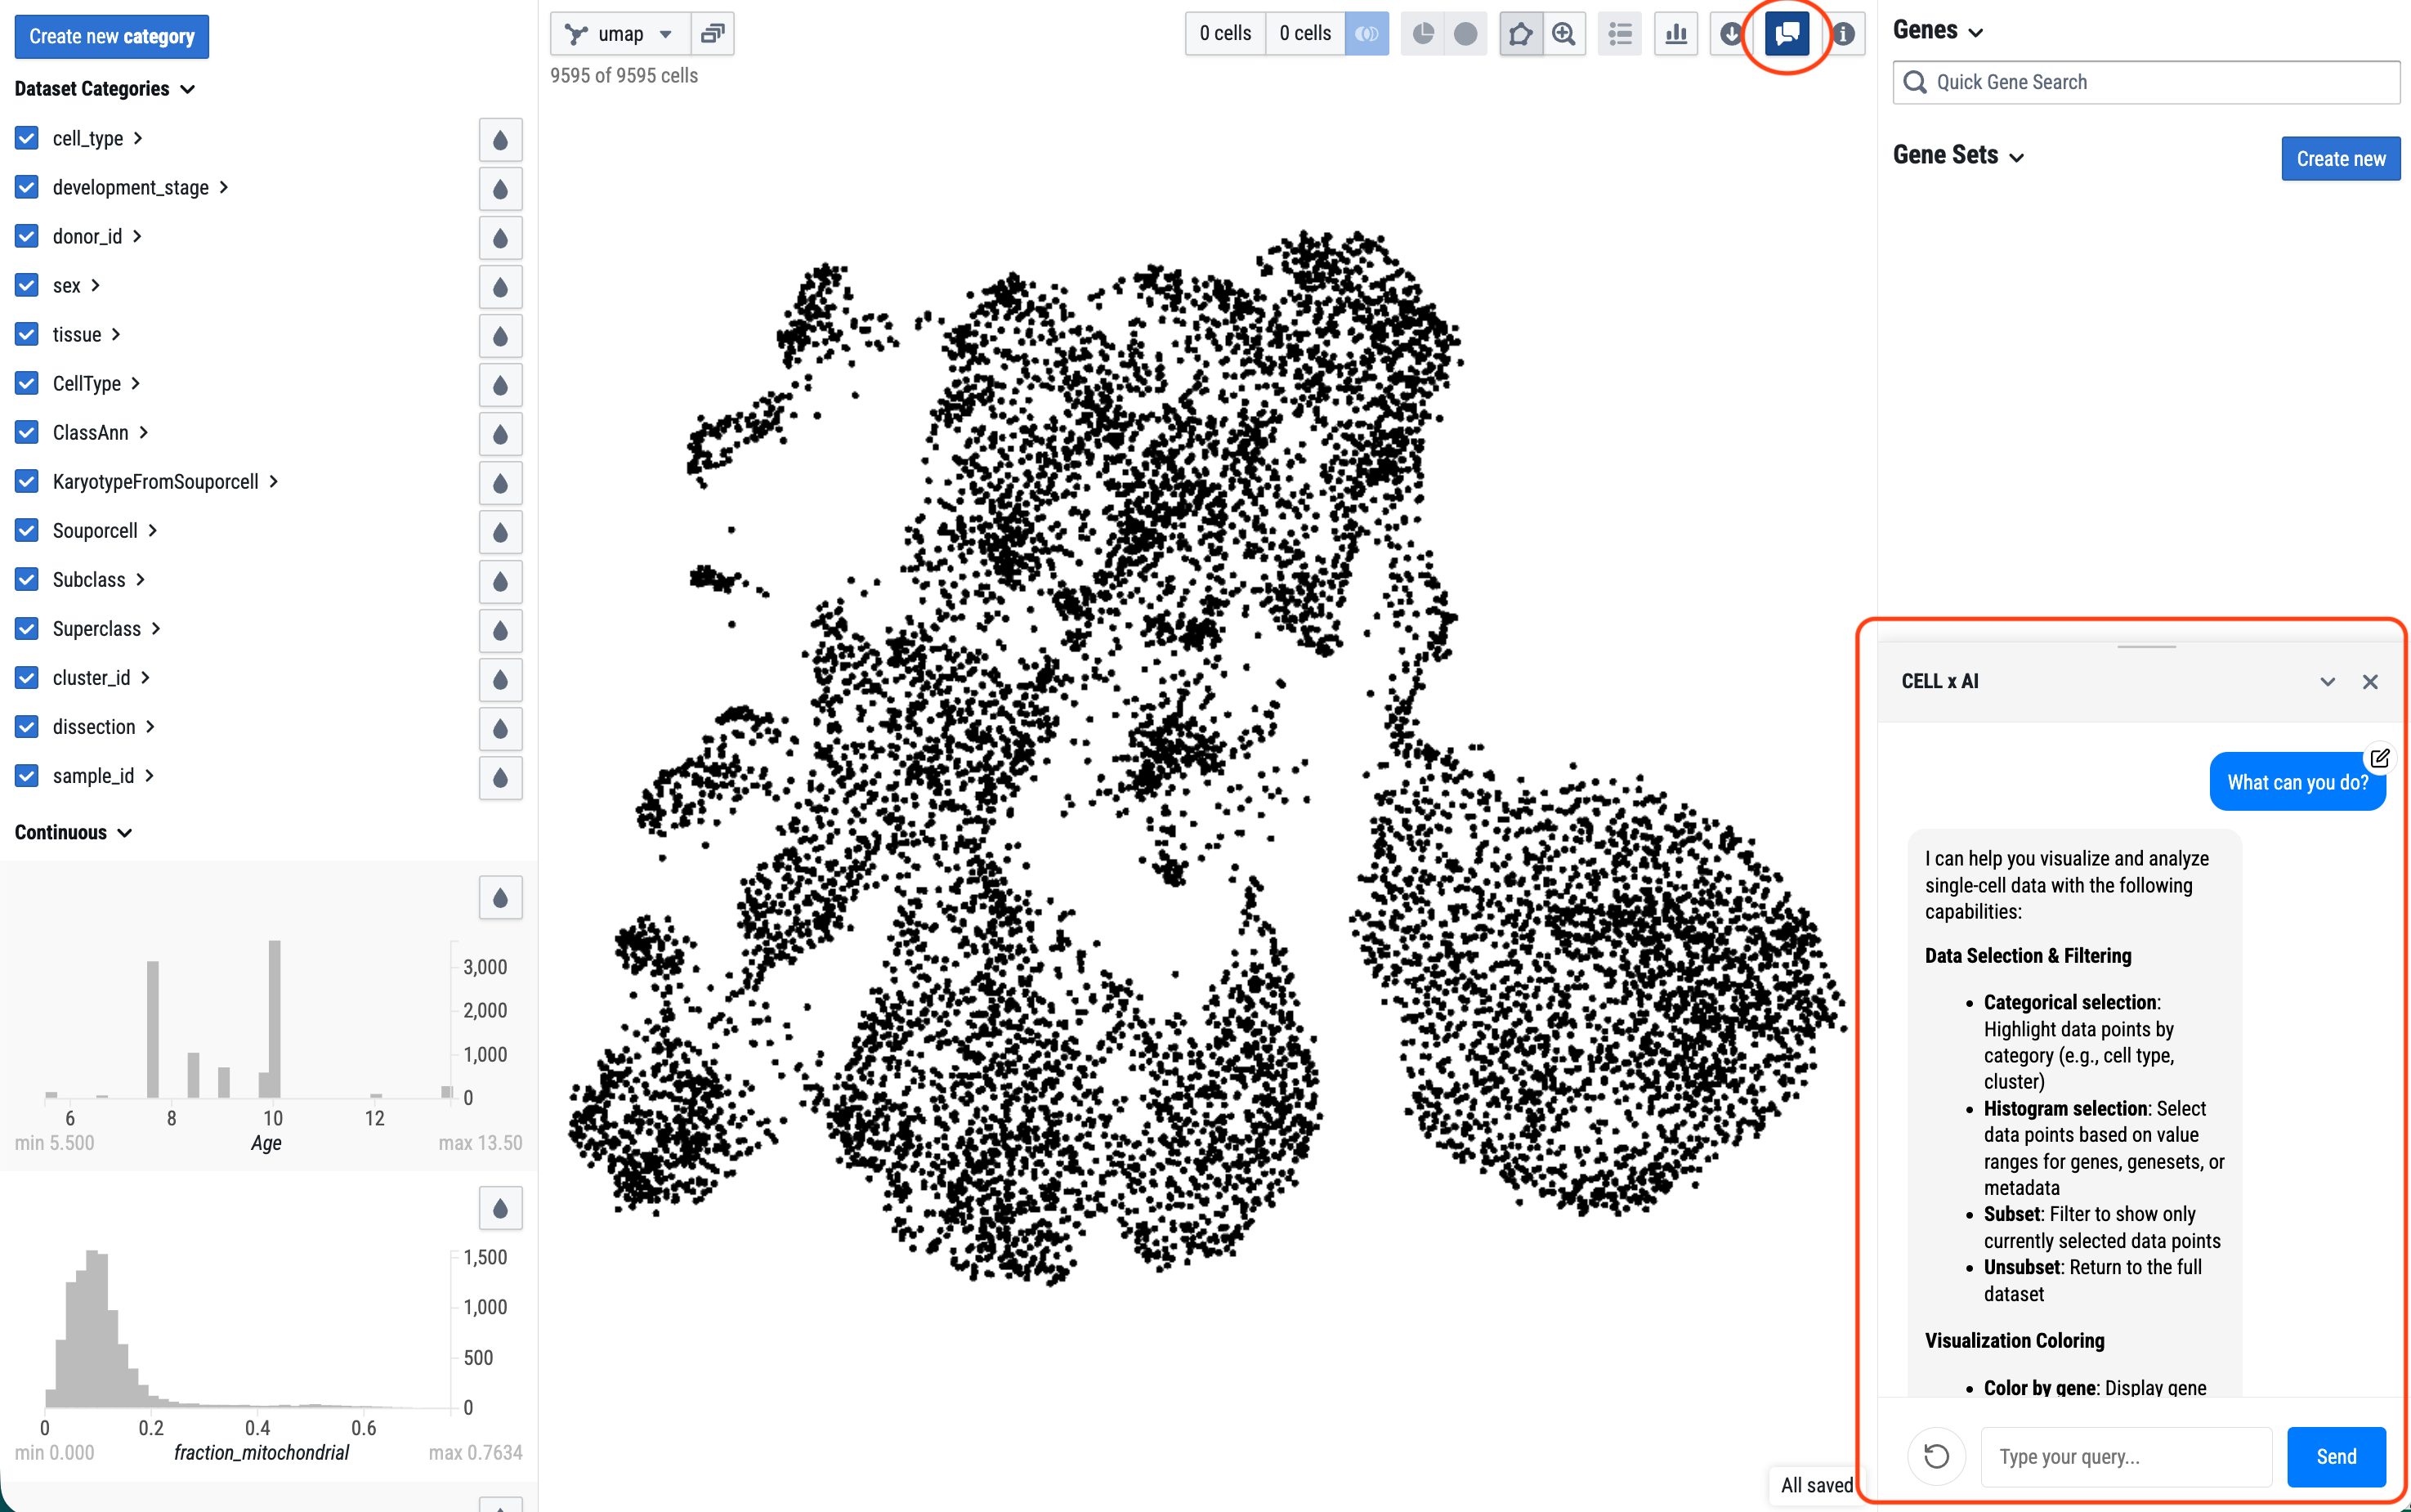
Selecting the “AI assistant” icon will bring up a window where you can interact with an AI agent to help with data analysis. Some tasks the AI assistant can help with include: “Color the data by Cell_type (or one of the metadata),” “Create a geneset of T cell marker genes,” or "Explore XXX gene in the data.”. Or you can start by asking it for its capabilities and proceed from there.
Currently, the agent can change the data visualization and user interface display and will not modify the underlying data or databases. Review all content the AI assistant creates for you as this feature is still under active development.